
 [3 min read, open as pdf]
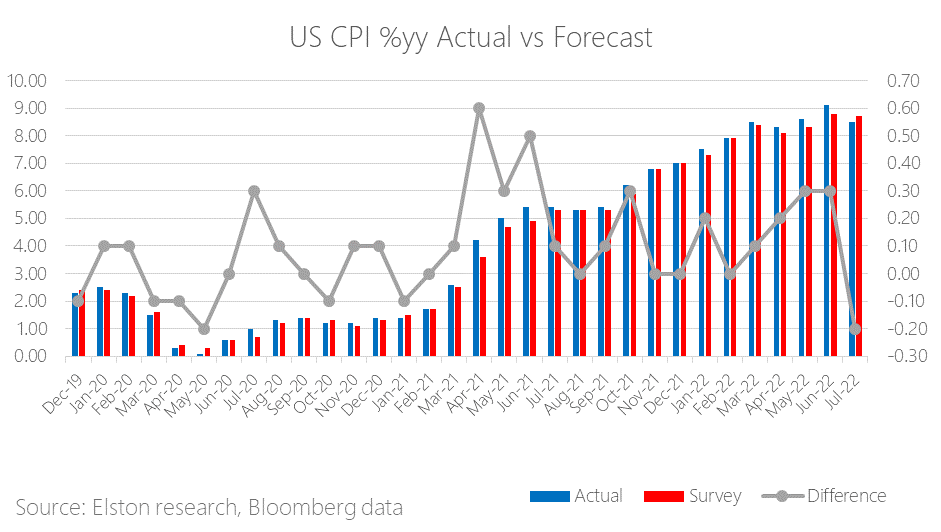
Latest US inflation figures The latest US inflation came in at 8.5%yy for July 2022, lower than survey estimate. This is down from 40-year high of 9.1%yy last month and is lower than expectations of 8.7%. Gasoline prices fell by 7.7% in July, compared to an increase of 11.2%yy in June 2022. Food prices continued rising at a fast rate of 10.9%yy. Shelter cost moved higher by 0.5% from last month and went up by 5.7% from the same time last year. Read in full including charts 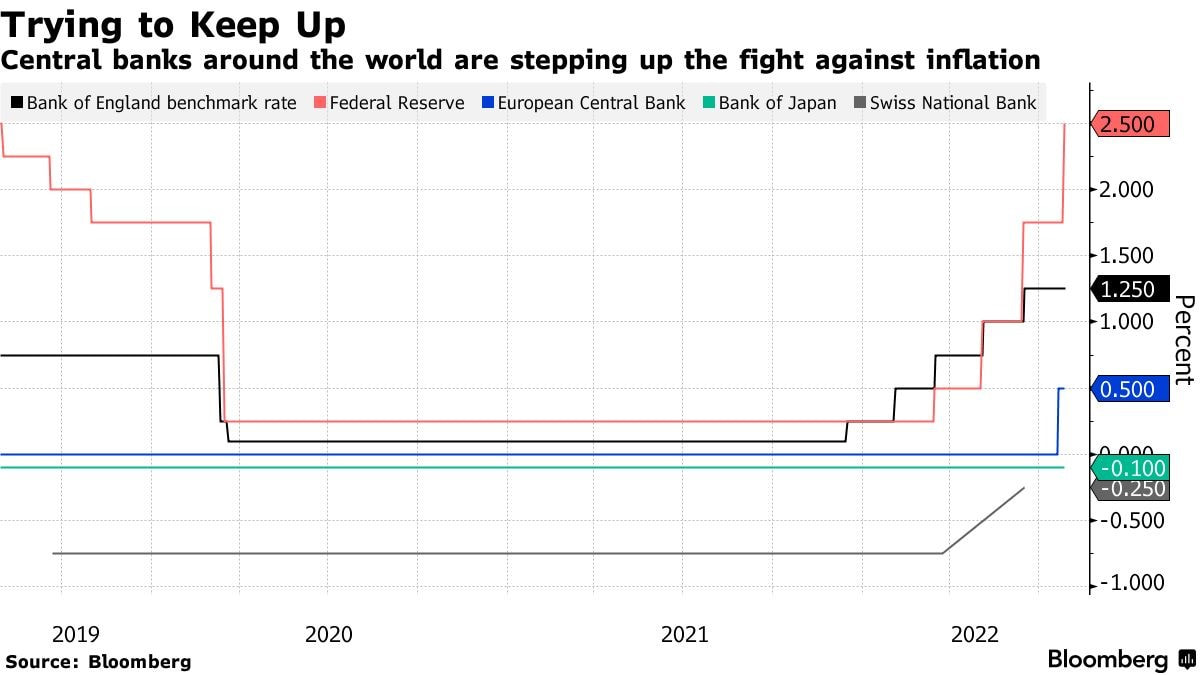 [3 min read, open as pdf]
On 4th August, the Bank of England raised rates by 0.5%, the largest single increase since 1995. This followed the US Federal Reserve raising rates by 0.75% at the end of July. While these rate rises may or may not bring inflation under control, the risk they pose to growth is considerable. We consider the ways in which investors can use ETFs to build defensive resilience as an alternative to low-yielding cash or bonds. 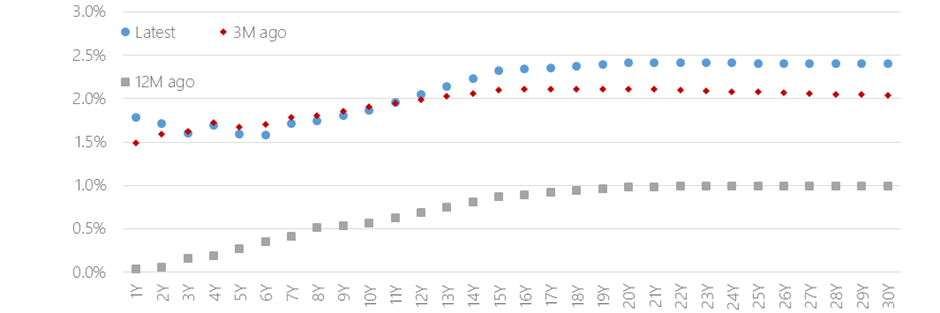 [3 min read, open as pdf]
What is the yield curve and how does it illustrate future expectations for the economy? In this article, we explain how to read the yield curve and discuss what the current version is suggesting in terms of inflation, interest rates and recession. With inflation at current levels, nominal bonds will remain under pressure. We explore the more resilient alternatives within the bonds universe as well as property, infrastructure, liquid real assets and targeted absolute return funds.
For full article, see Trustnet. 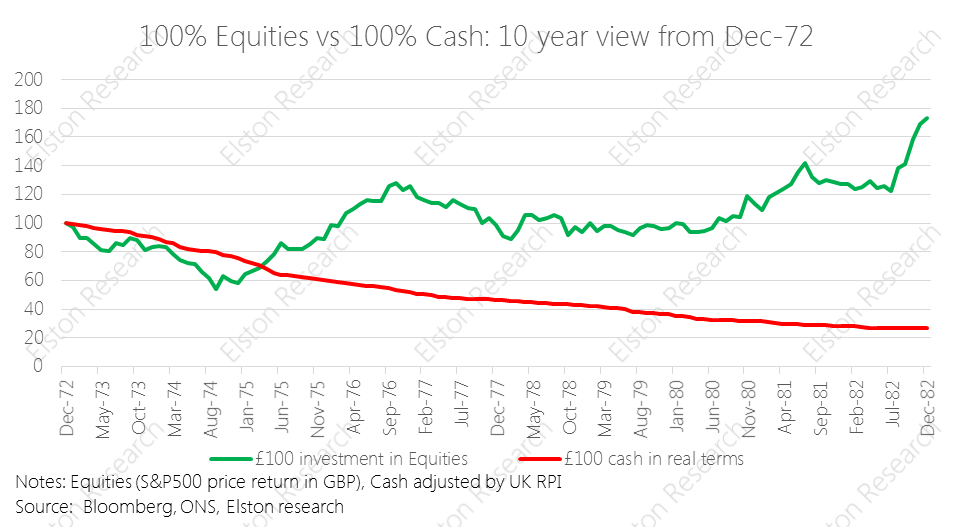 [5 min read, open as pdf]
Read full article with charts 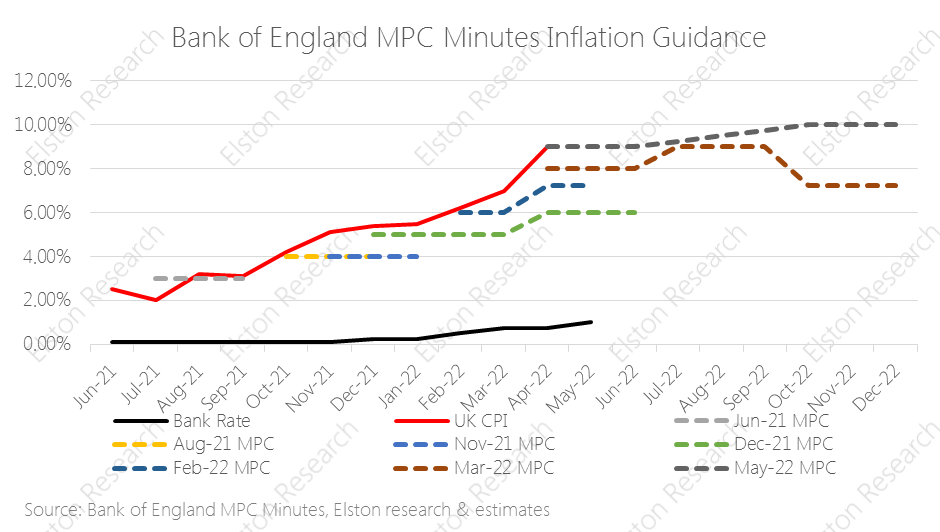 [5 min read, open as pdf]
Inflation hits 40 year high UK inflation figures came out today with a print of +9.0%yy (April), from +7.0% (March) and slightly below +9.1%yy consensus estimate. This is the highest level in 40 years, putting renewed focus on the “cost of living crisis”. Rising energy and food costs are the primary drivers, linked to the sanctions regime and the Russia/Ukraine war. The Bank of England has been “behind the curve” as regards to inflation risk. A look at inflation guidance contained in recent Monetary Policy Committee (MPC) minutes shows. Near-term inflation guidance has consistently under-estimated inflation since August 2021 – rising from “above 2%”, to 4%, 6%, 8%,, 9% and now 10%. Read full article with charts 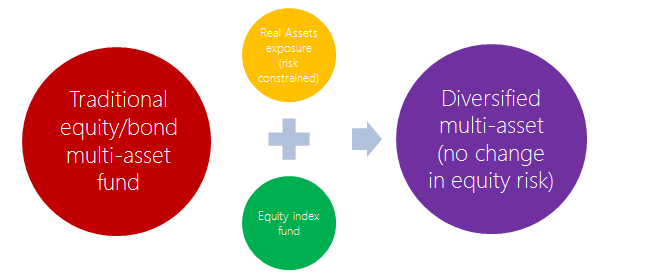 [5 min read, full article in pdf]
In theory, through 2021 we have argued that bonds would remain under pressure against the twin pressures of rising interest rates and rising inflation. In practice, market dislocations of 1q22 evidenced this as bonds provide no place to hide in a time of market stress, and lost both their diversification and their protection characteristics. Indeed, the losses sustained on the bond side of a traditional multi-asset equity/bond portfolio were more extreme than the losses sustained on the equity side. The pressure on bonds will continue so long as we are in an inflationary regime. And that may be for the medium-term (e.g. 5 or more years based on market implied inflation rates). This is forcing a rethink for advisers reliant on equity/bond multi-asset funds to deliver a core investment strategy for their clients. [Read full article in pdf] Find out more about our Liquid Real Assets index strategy 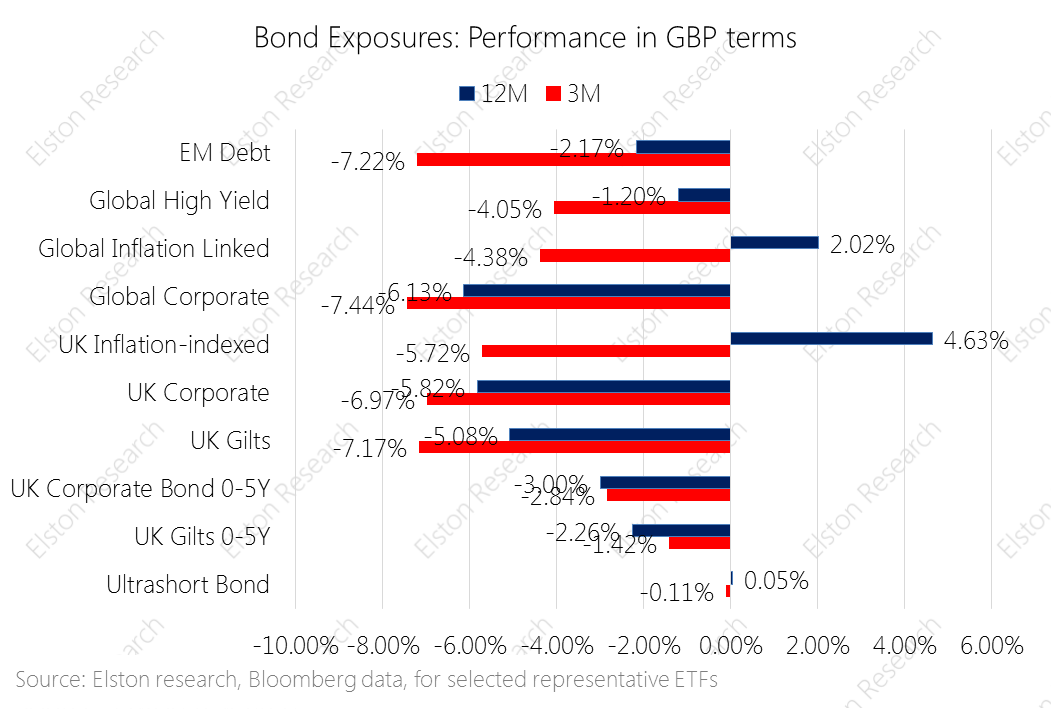 [5 min read, open as pdf for full article]
Equity markets endured a triple shock in the first quarter of 2022: a dramatic steepening of the likely path of interests, multi-year high inflation levels and a horrific war unleased in Ukraine. The traditional rational for including nominal bonds was to provide steady income, lower but positive returns, and diversification – a place of safety in periods of market stress. In face of rising inflation and rising interest rates, nominal bonds are providing none of these portfolio functions. Indeed in 1q22 not a single bond exposure delivered positive returns, and over 12 months only inflation-linked exposures delivered positive returns. Open as pdf for full article CPD Webinar Alternatives to Bonds in a Portfolio  [5 min read, open as pdf]
In a recent CPD webinar, Elston’s Henry Cobbe interviewed Patrick Minford, Professor of Applied Economics at Cardiff University and economic adviser to Margaret Thatcher in the late 1970s and early 1980s to ask about the fight with inflation in the 1970s and any comparisons for today. While it is tempting to look for similarities with the energy shock and period of sustained inflation that the UK suffered in the late 1970s and early 1980s, Professor Minford highlighted some significant differences. The lower risk of a wage-price spiral, central bank independence and a track record of manging inflation means lower risk of inflation getting out of control in the long-term. But the short- to medium-term remains under pressure. In Minford’s opinion, the risk to the growth is the bigger risk: and this would be the right time for HM Treasury to worry less about debt ratios, and turn on Government spending taps. Read full article, open as pdf Watch the CPD webinar (50mins)  [5 min read, open as pdf]
Rising inflation and rising interest rates, means nominal bonds (such as corporate bonds, UK gilts, and global government bonds) are under pressure, and will remain so for the medium-term. For so long as real yields remain negative, bonds are “guaranteed” to lose capital value in real terms over time. So what are the Alternatives to Bonds in a portfolio for UK investors? We explore the options within this article open as pdf or full version  [5 min read, open as pdf]
In our 2022 outlook, we explained why inflation will remain hotter for longer and will settle above pre-pandemic levels. Advisers should consider how to adapt portfolios for inflation across each asset class – equities, bonds and alternatives. Research demonstrates how different asset classes exhibit different degrees of inflation protection over different time-frames. Equities therefore provide a long-term inflation hedge.
In this article, we explore how to adapt portfolios for inflation within and across each asset class: Equities, Bonds and Alternatives. For full article, read as pdf  [3 min read, open as pdf]
2021 in review Our 2021 market roundup summarises another strong year for markets in almost all asset classes except for Bonds which remain under pressure as interest rates are expected to rise and inflation ticks up. Listed private equity (shares in private equity managers) performed best at +43.08%yy in GBP terms. US was the best performing region at +30.06%. Real asset exposures, such as Water, Commodities and Timber continued to rally in face of rising inflation risk, returning +32.81%, +28.22% and +17.66% respectively. 2022 outlook We are continuing in this “curiouser, through-the-looking glass” world. Traditionally you bought bonds for income, and equity for risk. Now it’s the other way round. Only equities provide income yields that have the potential to keep ahead of inflation. Bonds carry increasing risk of loss in real terms as inflation and interest rates rise. Real yields, which are bond yields less the inflation rate, are negative making traditional Bonds which aren’t linked to inflation highly unattractive. Bonds that are linked to inflation are highly sensitive to rising interest rates (called duration risk), so are not attractive either. How to navigate markets in this context? The big three themes for the year ahead are, in our view:
See full report in pdf Attend our 2022 Outlook webinar  [5 min read, open as pdf]
Interest rates expected to rise As the run up in inflation looks more persistent, than transitory, there is growing likelihood that Central Banks will raise interest rates in response. Following an extended “lower for longer” near-Zero Interest Rate Policy following the 2008 Global Financial Crisis and the 2020 COVID Crisis, the market futures-implied expectations for the Fed Funds rate, points to a “take off” in 2022 in response to rising inflation, following COVID-related policy support, to an expected 1.01% interest rate level in Dec-23[1], from 0.88% last quarter. Fig.1. Fed Funds Rate and implied expectations 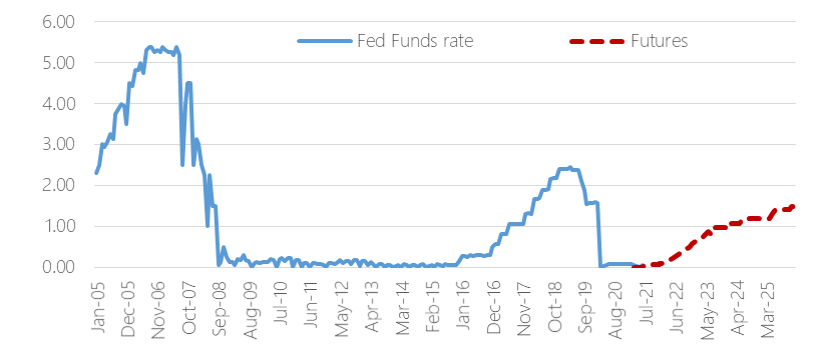 Source: Elston research, Bloomberg data
The potential for increased interest rate volatility, as rate hike expectations increase, means that investors that are seeking to dampen interest rate sensitivity (“duration”) are allocating to shorter-duration exposures, such as ultrashort-duration bonds, and also to Floating Rate Notes (FRNs). What is a Floating Rate Note? Floating Rate Notes receive interest payments that are directly linked to changes in near-term interest rates and can therefore provide a degree of protection against interest rate risk, when interest rates are rising. Issued for the most part by corporations, FRNs pay a periodic coupon – typically quarterly – that resets periodically in line with short-term interest rates. This could be expressed as a premium or “spread” over a currency’s short-term risk-free rate, such as (in the UK) the 3 month SONIA rate (Sterling Overnight Index Average, and prior to that GBP LIBOR) in the UK, or (in the US) the 3 month SOFR (Secured Overnight Funding Rate, and prior to that USD LIBOR). These indices overnight borrowing rates between financial institutions. The size of the premium or spread reflects the creditworthiness of the issuer: the higher the spread, the greater the rewarded risk for owning that security, and typically stays the same for the life of the bond and is based on the issuer’s credit risk as deemed by the market. How can FRNs benefit investors? Floating Rate Notes are a lower-risk way of putting cash to work and provide a useful direct hedge against interest rate fluctuations. When incorporated into a bond portfolio, they can help bring down duration given their reduced sensitivity to interest rate changes, as well as provide a return pattern that is directly and positively correlated with changes in interest rates. Compared to nominal bonds, such as Corporate Bonds and UK Gilts, FRNs’ yield can increase as/when interest rates increase. Relative to money market funds, FRNs may provide some additional yield pick-up, as well as very short <1 year duration. Key considerations when investing in FRNs Portfolio investors can access FRNs through funds and ETFs. Key considerations when investing in FRNs include, but are not limited to:
Summary The expected timing of interest rate “lift off” in the US and UK will change as markets adapt to evolving growth and inflation outlook during the post-COVID recovery, and in response to the risk of further disruption from new virus variants. However, as interest rate rises become more likely, and incorporating an allocation to Floating Rate Notes for protection against interest rate risk makes sense within the bond allocation. Watch the CPD Webinar: The Quest for Yield [1] Data as at last quarter end  Register for the webinar/View the replay Read the full article
What is the 60/40 portfolio? Trying to find the very first mention of a 60/40 portfolio is a challenge, but it links back to Markowitz Modern Portfolio Theory and was for many years seen as close to the optimal allocation between [US] equities and [US] bonds. Harry Markowitz himself when considering a “heuristic” rule of thumb talked of a 50/50 portfolio. But the notional 60/40 equity/bond portfolio has been a long-standing proxy for a balanced mandate, combining higher-risk-return growth assets with lower-risk-return income-generating assets. What’s in a 60/40? Obviously the nature of the equity and the nature of the bonds depend on the investor. US investors look at 60% US equities/40% US treasuries. Global investors might look at 60% Global Equities/40% Global Bonds. For UK investors – and our Elston 60/40 GBP Index – we look at 60% predominantly Global Equities and 40% predominantly UK bonds Why does it matter? In the same way as a Global Equities index is a useful benchmark for a “do-nothing” stock picker, the 60/40 portfolio is a useful benchmark for a “do-nothing” multi-asset investor. Multi-asset investors, with all their detailed decision making around asset allocation, risk management, hedging overlays and implementation options either do better than, or worse than this straightforward “do-nothing” approach of a regularly rebalanced 60/40 portfolio. Indeed – its simplicity is part of its appeal that enables investors to access a simple multi-asset strategy at low cost. The problem with bonds (the ‘40’) in an inflationary environment Over the years, the relationship between asset classes has changed so much that the validity of 60/40 as a strategy can legitimately be questioned. Read the full article or register for the webinar/View the replay  [Open as pdf]
Money market funds, and their exchange-traded equivalents “ultra-short duration bond funds”, are an important, if unglamorous, tool in portfolio manager’s toolkit. They can be used in place of a cash holding for additional yield, without compromising on risk, liquidity or cost. Money market funds are intended to preserve capital and provide returns similar to those available on the wholesale money markets (e.g. the SONIA rate that replace LIBOR). How risky is a money market fund? Money market-type funds hold near-to maturity investment grade paper. Their weighted average term to maturity is <1 year. They therefore have very low effective duration (the sensitivity to changes in interest rates). Compare gilts which are seen as a low-risk asset relative to equities. The 10-11 year duration on UK gilts (all maturities) means they carry a higher level volatility compared to cash (which has nil volatility). On the flip side, their longer term also means they have higher risk-return potential relative to cash and ultra-short bonds. By contrast, money market type funds have some investment risk as they hold non-cash assets, but given their holdings’ investment grade status, short term to maturity and ultra-short effective duration, they exhibit near-nil volatility. Platform cash, fixed term deposit or money market fund From a flexibility perspective and a value for money perspective, there's a clear rationale to hold money market funds, rather than platform cash or a fixed term deposit. Our Money Markets fund research paper that looks at 4 low cost money market funds sets out why Why does the fund structure make sense? Find out more in our CPD Webinar on Introduction to Collective Investment Schemes  [ 5 min read, open as pdf]
Since an article published in 2019 pointed the historic lows in bond yields, many investment firms are starting to rethink the 60/40 portfolio. This came under even more scrutiny following the market turmoil of 2020. While some affirm that the 60/40 will outlive us all, others argue against this notion. We take a look at the main arguments for and against and key insights What is a 60/40 portfolio? A 60/40 equity/bond portfolio is a heuristic “rule of thumb” approach considered to be a proxy for the optimal allocation between equities and bonds. Conventionally equities were for growth and bonds were for ballast. The composition of a 60/40 portfolio might vary depending on the base currency and opportunity set of the investor/manager. Defining terms is therefore key. We summarise a range of potential definitions of terms: 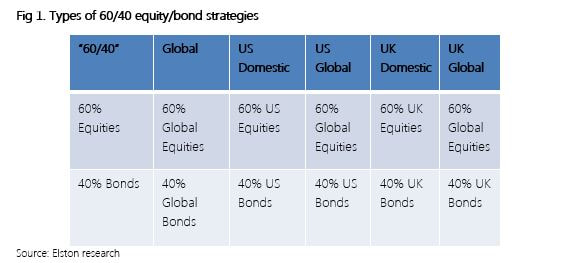 Furthermore, whilst 60/40 seems simple in terms of asset weighting scheme, it is important to understand the inherent risk characteristics that this simple allocation creates. For example, a UK Global 60/40 portfolio has 62% beta to Global Equities; equities contribute approximately 84% of total risk, and a 60/40 portfolio is approximately 98% correlated to Global Equities[1]. [1] Elston research, Bloomberg data. Risk Contribution based on Elston 60/40 GBP Index weighted average contribution to summed 1 Year Value At Risk 95% Confidence as at Dec-20. Beta Correlation to Global Equities based on 5 year correlation of Elston 60/40 GBP Index to global equity index as at Dec-20. 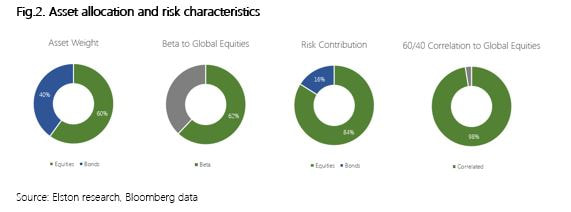 Why some think 60/40 will outlive us all. The relevance of 60/40 portfolio lies in its established historic, mathematical and academic backup. Whilst past performances do not guarantee future returns, it nonetheless provides us with experience and guidance. (Martin,2019) Research also suggests that straightforward heuristic or “rule-of-thumb” strategies work well because they aren’t likely to inspire greed or fear in investors. They become timeless. Thus, creating a ‘Mind-Gap’. (Martin,2019) In the US, the Vanguard Balanced Index Fund (Ticker: VBINX US) which combines US Total Market Index and 40% into US Aggregate bonds, plays a major role in showcasing the success of the 60/40 portfolio that has proved popular with US retail investors (Jaffe,2019). Similarly, in the UK the popularity of Vanguard LifeStrategy 60% (Ticker VGLS60A) showcases the merits of a straightforward 60/40 equity/bond approach. In 2020, for US investors VBINX provided greater (peak-to-trough) downside protection owing to lower beta (-19.5% vs -30.3% for US equity) and delivered total return of +16.26% volatility of 20.79%, compared to +18.37% for an ETF tracking the S&P 500 with volatility of 33.91%, both funds are net of fees. In this respect, the strategy captured 89% of market returns, with 61% of market risk. 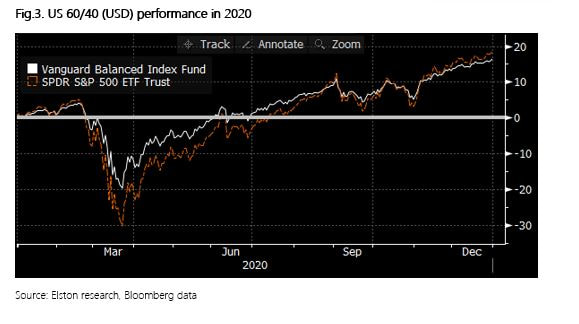 For GBP-based investors in 2020 the 60/40 approach had lower (peak-to-trough) drawdown levels (-15%, vs -21% for global equities) owing to lower beta. The 60% equity fund delivered total return of +7.84% with volatility of 15.12%, compared to +12.15% for an ETF tracking the FTSE All World Index with volatility of 24.29%. In this respect, the strategy captured 65% of market returns, with 62% of market risk. 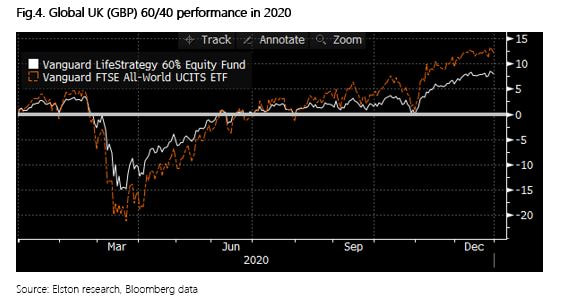 Why some think 60/40 has neared its end
Since its inception the 60/40 portfolio, derived 90% of the risk from stocks. In simple terms, 60% of the asset allocation of the portfolio was therefore the main driver of the portfolio. Returns (Robertson,2021). This hardly a surprise given that equities have a 84% contribution to portfolio ris, on our analysis, but the challenge made by some researchers is that if a 60/40 portfolio mainly reflects equity risk, what role does the 40% bond allocation provide, other than beta reduction? The bond allocation is under increasing scrutiny now is because global economic growth has slowed and traditionally safer asset classes like bonds have grown in popularity making bonds susceptible to sharp and sudden selloffs. (Matthews,2019) Strategists such as for Woodard and Harris, for Bank of America and Bob Rice for Tangent Capital have stated in their analysis that the core premise of the 60/40 portfolio has declined as equity has provided income, and bonds total return, rather than the other way round.. (Browne,2020) Another study shows that over the past 65 years bonds can no longer effectively hedge against inflation and risk reduction through diversification can be done more adequately by exploring alternatives such as private equity, venture capital etc. (Toschi, 2021). Left unconstrained, however, this can necessarily up-risk portfolios. With bond yields at an all-time low, nearing zero and the fact that they can no longer provide the protection in the up-and-coming markets many investors query the value provided by a bond allocation within a portfolio. (Robertson,2021) Key insights While point of views might differ about 60/40 as an investment strategy, one aspect that is accepted is that the future of asset allocation looks very different when compared to the recent past. Rising correlations, low yields have led strategists and investors to incorporate smarter ways of risk management, explore new bond markets like China, create modified opportunities for bonds to hedge volatility through risk parity strategies, as well as using real asset exposure such as real estate and infrastructure. (Toschi, 2021) Research conducted by The MAN Institute summarises that modifying from traditional to a more trend-following approach introduces the initial layer of active risk management. By adding an element of market timing investors further reduce the risk, when a market’s price declines. While bonds have declined in yield, they still hold importance in asset allocation for beta reduction. Further diversifying the portfolio with an allocation to real assets has potential to provide more yield and increased return than government bonds. Summary The 60/40 portfolio strategy has established itself over many decades, it has seen investors through four major wars, 14 recessions, 11 bear markets, and 113 rolling interest rate spikes. It has proved resilience as a strategy and utility as a benchmark. Our conclusion is that 60/40 is not dead: it is a useful multi-asset benchmark and remains a starting point for strategic asset allocation strategies. But the detail of the bond allocation needs a rethink. Incorporating alternative assets or strategies so long as any increased risk can be constrained to ensure comparable portfolio risk characteristics. Henry Cobbe & Aayushi Srivastava Elston Consulting Bibliography Browne, E., 2021. The 60/40 Portfolio Is Alive and Well. [online] Pacific Investment Management Company LLC. Available at: https://www.pimco.co.uk/en-gb/insights/blog/the-60-40-portfolio-is-alive-and-well Jaffe, C., 2019. No sale: Don’t buy in to ‘the end’ of 60/40 investing. [online] Seattle Times. Available at: https://www.seattletimes.com/business/no-sale-dont-buy-in-to-the-end-of-60-40-investing/ Martin, A., 2019. The 60/40 Portfolio Will Outlive Us All. [online] Advisorperspectives.com. Available at:https://www.advisorperspectives.com/articles/2019/11/11/the-60-40-portfolio-will-outlive-us-all#:~:text=As%20two%20recent%20commentaries%20demonstrate,40%20will%20outlive%20us%20all. Matthews, C., 2021. Bank of America declares ‘the end of the 60-40’ standard portfolio. [online] MarketWatch. Available at:https://www.marketwatch.com/story/bank-of-america-declares-the-end-of-the-60-40-standard-portfolio-2019-10-15 Robertson, G., 2021. 60/40 in 2020 Vision | Man Institute. [online] www.man.com/maninstitute. Available at:https://www.man.com/maninstitute/60-40-in-2020-vision Toschi, M., 2021. Why and how to re-think the 60:40 portfolio | J.P. Morgan Asset Management. [online] Am.jpmorgan.com. Available at: https://am.jpmorgan.com/be/en/asset-management/adv/insights/market-insights/on-the-minds-of-investors/rethinking-the-60-40-portfolio/  [5min read, open as pdf]
We agree it’s time to rethink the 60/40 portfolio. It’s a useful benchmark, but a problematic strategy. What is the 60/40 portfolio, and why does it matter? What it represents? Trying to find the very first mention of a 60/40 portfolio is proving a challenge, but it links back to Markowitz Modern Portfolio Theory and was for many years seen as close to the optimal allocation between [US] equities and [US] bonds. Harry Markowitz himself when considering a “heuristic” rule of thumb talked of a 50/50 portfolio. But the notional 60/40 equity/bond portfolio has been a long-standing proxy for a balanced mandate, combining higher-risk return growth assets with lower-risk-return, income generating assets. What’s in a 60/40? Obviously the nature of the equity and the nature of the bonds depends on the investor. US investor look at 60% US equities/40% US treasuries. Global investors might look at 60% Global Equities/40% Global Bonds. For UK investors – and our Elston 60/40 GBP Index – we look at 60% predominantly Global Equities and 40% predominantly UK bonds Why does it matter? In the same way as a Global Equities index is a useful benchmark for a “do-nothing” stock picker, the 60/40 portfolio is a useful benchmark for a “do-nothing” multi-asset investor. Multi-asset investors, with all their detailed decision making around asset allocation, risk management, hedging overlays and implementation options either do better than, or worse than this straightforward “do-nothing” approach of a regularly rebalanced 60/40 portfolio. Indeed – its simplicity is part of its appeal that enables investors to access a simple multi-asset strategy at low cost. The problem with Bonds in a 60/40 framework In October 2019, Bank of America Merrill Lynch published a research paper “The End of 60/40” which argues that “the relationship between asset classes has changed so much that many investors now buy equities not for future growth but for current income, and buy bonds to participate in price rallies”. This has prompted a flurry of opinions on whether or not 60/40 is still a valid strategy The key challenges with a 60/40 portfolio approach is more on the bond side:
So is 60/40 really dead? In short, as a benchmark no. As a strategy – we would argue that for serious investors, it never was one. We therefore think it’s important to distinguish between 60/40 as an investment strategy and 60/40 as a benchmark. We think that a vanilla 60/40 equity/bond portfolio remains useful as a benchmark to represent the “do nothing” multi-asset approach. However, we would concur that a vanilla 60/40 equity/bond portfolio, as a strategy offered by some low cost providers does – at this time – face the significant challenges identified in the 2019 report, that have been vindicated in 2020 and 2021. For example, during the peak of the COVID market crisis in March 2020, correlations between equities and bonds spiked upwards meaning there was “no place to hide”. The growing inflation risk has put additional pressure on nominal bonds. Real yields are negative. Interest rates won’t go lower. But outside of some low-cost retail products, very few portfolio managers, would offer a vanilla equity/bond portfolio as a client strategy. The inclusion of alternatives have always had an important role to play as diversifiers. Rethinking the 40%: What are the alternatives? When it comes to rethinking the 60/40 portfolio, investors will have a certain level of risk budget. So if that risk budget is to be maintained, there is little change to the “60% equity” part of a 60/40 portfolio. What about the 40%? We see opportunity for rethinking the 40% bond allocation by: We nonetheless think it is important to:
1. Rethinking the bond portfolio Whilst more extreme advocates of the death of 60/40 would push for removing bonds entirely, we would not concur. Bonds have a role to play for portfolio resilience in terms of their portfolio function (liquidity, volatility dampener), so would instead focus on a more nuanced approach between yield & duration. We would concur that long-dated nominal bonds look problematic, so would suggest a more “barbell” approach between shorter-dated bonds (as volatility dampener), and targeted, diversified bond exposures: emerging markets, high yield, inflation-linked (for diversification and real yield pick-up). 2. Incorporating sensible alternative assets Allocating a portfolio of the bond portfolio to alternatives makes sense, but we also need to consider what kind of alternatives. Whilst some managers are making the case for hedge funds or private markets as an alternative to bonds, we think there are sensible cost-efficient and liquid alternatives that can be considered for inclusion that either have bond-like characteristics (regular stable income streams), or provide inflation protection (real assets). For regular diversified income and inflation protection, we would consider: asset-backed securities, infrastructure, utilities and property. The challenge, however, is how to incorporate these asset classes without materially up-risking the overall portfolio. For inflation protection, we would consider real assets: property, diversified, commodities, gold and inflation-protected bonds. Properly incorporated these can fulfil a portfolio function that bonds traditionally provided (liquidity, income, ballast and diversification). 3. Consider risk-based diversification as an alternative strategy One of the key reasons for including bonds in a multi-asset portfolio is for diversification purposes from equities on the basis that one zigs when the other zags. In the short-term, and particularly at times of market stress, correlations between asset classes can increase, this reduces the diversification effect if bonds zag when equities zag. We would argue risk-based diversification strategies have a role to play to here, on the basis that rather than relying on long-run theoretical correlation, they systematically focus on short-run actual correlation between asset classes and adapt their asset allocation accordingly. Traditional portfolios means choosing asset weights which then drive portfolio risk and correlation metrics. Risk-based diversification strategies do this in reverse: they use short-run portfolio risk and correlation metrics to drive asset weights. If the ambition is to diversify and decorrelate, using a strategy that has this as its objective makes more sense. Summary So 60/40 is not dead. It will remain a useful benchmark for mult-asset investors. As an investment strategy, vanilla 60/40 equity/bond products will continue to attract assets for their inherent simplicity. But we do believe a careful rethink of the “40” is required.  [3 min read, open as pdf]
A “last resort” policy tool Zero & Negative Interest Rate Policy are Non-Traditional forms of Monetary Policy is a way of Central banks creating a disincentive for banks to hoard capital and get money flowing. Zero Interest Rate Policy (ZIRP) is when Central Banks set their “policy rate” (a target short-term interest rate such as the Fed Funds rate of the Bank of England Base Rate) at, or close to, zero. ZIRP was initiated by Japan in 1999 to combat deflation and stimulate economic recovery after two decades of weak economic growth. Negative Interest Rate Policy (NIRP) is when Central Banks set their policy rate below zero. Japan, Euro Area, Denmark, Sweden are currently using a NIRP. US & UK are currently using a ZIRP, and are considering a NIRP. Fig.1. Advanced economy policy rates 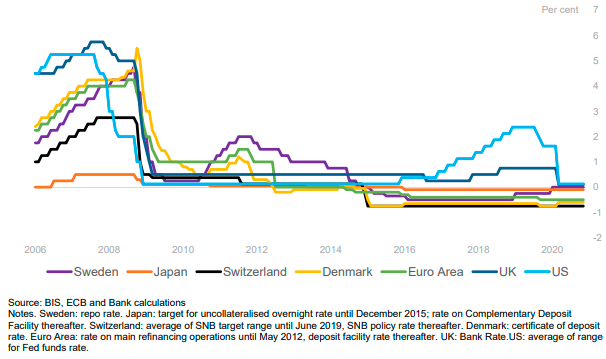 Whilst bond prices may imply negative real yield, or negative nominal yields, a NIRP impacts the rates at which the Central Bank interact with the wholesale banking system and is intended to stimulate economic activity by disincentivising banks to hold cash and get money moving. A NIRP could translate to negative wholesale rates between banks, and negative interest rates on large cash deposits, but not necessarily retail lending rates (e.g. mortgages).
Ready, steady, NIRP Negative Interest Rates were used in the 1970s by Switzerland as an intervention to dampen currency appreciation. . It was the subject of academic studies and was seen as a last resort Non-Traditional Monetary policy during the Financial Crisis of 2008 and during the COVID crisis of 2020. Sweden adopted NIRP in 2009, Denmark in 2012, and Japan & Eurozone in 2014. The Fed started looking closely at NIRP in 2016. According Bank of England MPC minutes of 3rd March 2021, wholesale markets are generally prepared for negative interest rates as have already been operating in a negative yield environment. By contrast, retail banks may need more time to prepare for negative interest rates to consider aspect such as variable mortgage rates. There are arguments for and against NIRP. The main argument for is that NIRP is stimulatory. The main argument against is that NIRP failed to address stagnation and deflation in Japan and can create a “liquidity trap” where corporates hoard capital rather than spend and invest. The hunt for yield With negative interest rates, there will be an even greater hunt for yield. We look at the some of the options that advisers might be invited to consider.
Getting the balance right between additional non-negative income yield and additional downside risk will be key for investors and their advisers when preparing for and reacting to a NIRP environment. 
In this report, we analyse the data around a selected opportunity set of bond indices as represented by London-listed ETFs. The report covers global, USD, EUR, GBP and Emerging Market bond markets, for aggregate, government, corporate, high yield and emerging market exposures. Whilst the bond market dwarfs the equity market, the majority of ETFs are focused on equity exposures. That is gradually changing with growing acceptance of bond ETFs as a convenient and liquid way of accessing targeted bond exposures by geography, issuer type, credit quality, or maturity profile. In this report, we:
For more information and important notices, view the full report. Disclosure: I/we have no positions in any stocks mentioned, and no plans to initiate any positions within the next 72 hours. Business relationship disclosure: This article references research by Elston Consulting that is sponsored by State Street Global Advisors Limited. I wrote this article myself, and it expresses my own opinions. Additional disclosure: This article has been written for a UK audience. Tickers are shown for corresponding and/or similar ETFs and may be prefixed by the relevant exchange code, e.g. “LON:” (London Stock Exchange) for UK readers. For research purposes/market commentary only, does not constitute an investment recommendation or advice, and should not be used or construed as an offer to sell, a solicitation of an offer to buy, or a recommendation for any product. This blog reflects the views of the author and does not necessarily reflect the views of Elston Consulting, its clients or affiliates. For information and disclaimers, please see www.ElstonETF.com All product names, logos, and brands are property of their respective owners. All company, product and service names used in this website are for identification purposes only. Use of these names, logos, and brands does not imply endorsement. Image credit: Elston; Chart credit: n.a.; Table credit: n.a.
What’s new? A bond ETF is not brand new: the first bond ETF launched back in 2002. But they are gaining traction, and as adoption increases the breadth and depth of bond ETFs have also broadened. In my first DIY multi-asset ETF portfolio back in 2008, the main bond ETFs available back then were for broad exposures like Gilts, Index-Linked Gilts and Corporate Bonds. Fast forward over ten years and there’s the ability to access much more targeted exposures. Investors can access both corporate and government bonds for GBP issuers as well as for major currency issuers such as USD and EUR, both unhedged and hedged to GBP. Furthermore, within these opportunity sets investors can select from a range of investment term options, whether short-term (e.g. <5 years), medium term (e.g. 5-10 years), or long-term (>10 years). As well as high yield bonds, more specialised bond exposures are also increasingly available. So whatever the exposure, there is an investable index to express it, and increasingly an ETF to track it. But what is a bond ETF and what are the benefits? A bond ETF is simply a bond fund that can be bought or sold on an exchange, like a share. This has three benefits: it enables access, provides diversification and creates liquidity. According to a recent survey of UK managers, while the access and diversification points are readily understood, there are concerns about liquidity.
Understanding bond ETF liquidity Ultimately the liquidity of a bond fund, whether a traditional fund or an ETF is only as good as the underlying asset. We can term this “internal liquidity”. But if liquidity of a fund itself is a concern then you are probably better off in a bond ETF than a traditional bond funds. Why is that? Simply put the stock exchange creates a secondary market for ETFs (buyers and sellers of bond ETFs trading with each other without necessarily requiring a creation or redemption of units of the bond ETF that would impact underlying bond liquidity). We can term this “external liquidity”. If liquidity of the underlying asset class was a concern and you wished to exit a traditional bond fund, your redemption would be at the discretion of the fund provider and in extremis, you may find yourself gated. So if bond liquidity is a concern, avoid traditional funds and stick to ETFs: there’s a secondary market for them other than the fund issuer. Additional liquidity of bond ETFs By way of example, 2017 provided a stress test for the bond market – in particular high yield bonds. The findings are reassuring. When high yield bond yields spiked in March 2017 and high yield bond values came under pressure, we can see how high yield bond ETFs actually fared in these challenging conditions. The volumes of the secondary market trading between investors buying/selling on exchange (which requires no trading of the fund’s underlying securities) eclipsed net share redemptions (which does require trading of the underlying securities) by a significant factor. The volumes on secondary markets increased to an average of $12.7bn in the first two weeks of March (versus a previous nine-week average of $6.7bn), whilst the net redemptions of high yield bond ETFs was only $3.5bn (representing 6.1% of total assets). A similar resilience was exhibited in November 2017. So far from triggering a liquidity stampede in the underlying holdings, the presence of secondary market enabled investors to trade the ETF holding those bonds amongst themselves. This is why secondary market liquidity is seen as an advantage, rather than a disadvantage. Secondary Market Trading of High-Yield Bond ETFs Increased When Yields Rose in 2017, 29-Dec-16 to 29-Dec-17* 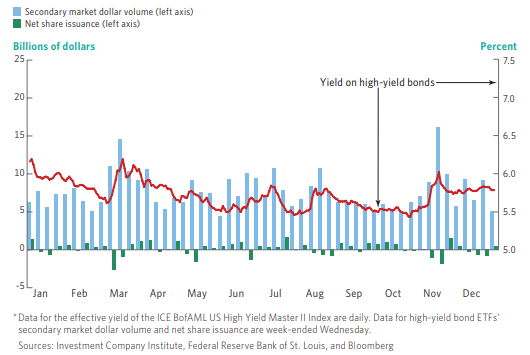 Source: ICI 2018 Factbook. Figure 4.6
The ratio of secondary market volume to net share issuance is therefore one measure of bond ETF liquidity, but the most indicative measure of bond ETF liquidity is bid-ask spread. Conclusion Innovation for bond ETF investing is focused on more nuanced index design and construction of bond ETFs which provide the tools managers need to reflect their views as regards issuer type, term and credit quality when allocating to bonds. The adoption of bond ETFs is demand-led as it enables access, provides diversification and creates liquidity. This is and should be welcome to investors large and small. For more information and important notices, view the full report. Disclosure: I/we have no positions in any stocks mentioned, and no plans to initiate any positions within the next 72 hours. Business relationship disclosure: The article includes references to research by Elston Consulting that was sponsored by State Street Global Advisors Limited. I wrote this article myself, and it expresses my own opinions. Additional disclosure: This article has been written for a UK audience. Tickers are shown for corresponding and/or similar ETFs and may be prefixed by the relevant exchange code, e.g. “LON:” (London Stock Exchange) for UK readers. For research purposes/market commentary only, does not constitute an investment recommendation or advice, and should not be used or construed as an offer to sell, a solicitation of an offer to buy, or a recommendation for any product. This blog reflects the views of the author and does not necessarily reflect the views of Elston Consulting, its clients or affiliates. For information and disclaimers, please see www.ElstonETF.com All product names, logos, and brands are property of their respective owners. All company, product and service names used in this website are for identification purposes only. Use of these names, logos, and brands does not imply endorsement. Image credit: n.a.; Chart credit: ICI; Table credit: n.a. |
ELSTON RESEARCHinsights inform solutions Categories
All
Archives
April 2024
|
 RSS Feed
Company |
Solutions |
|